


Return to the GPI page Go to Web Tools
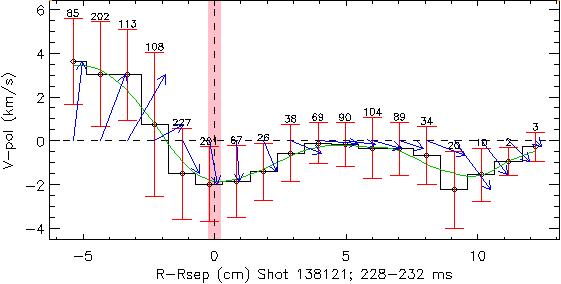
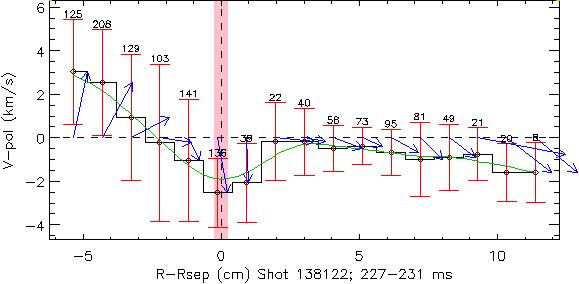
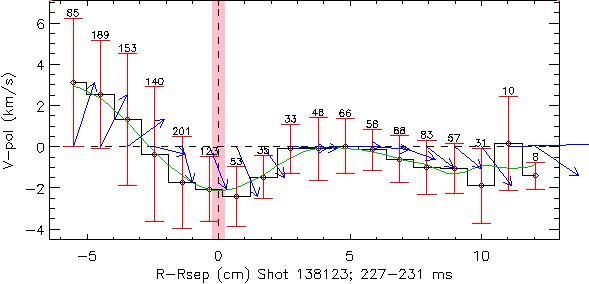
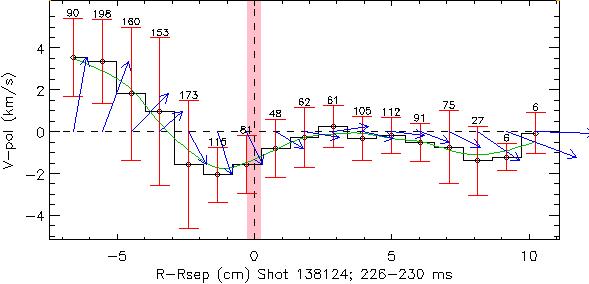
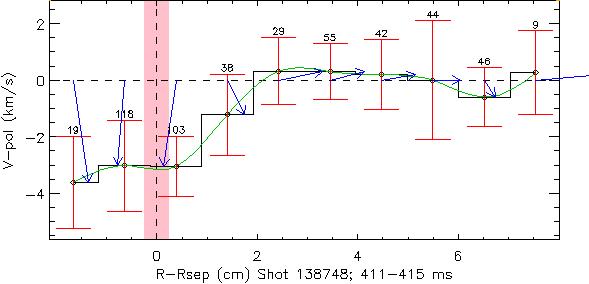
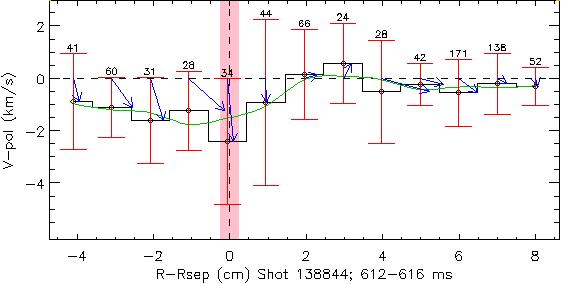
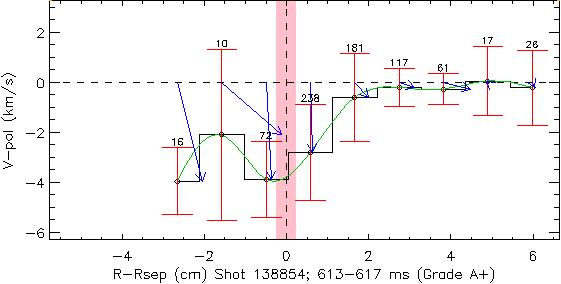
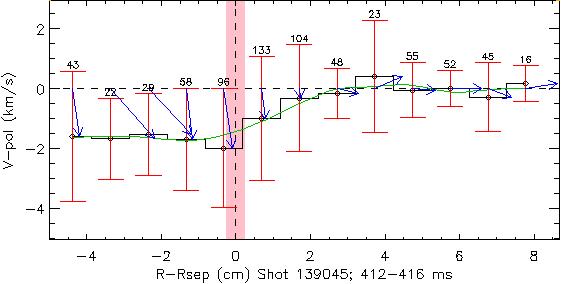
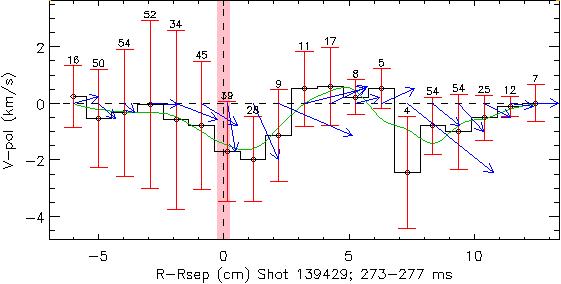
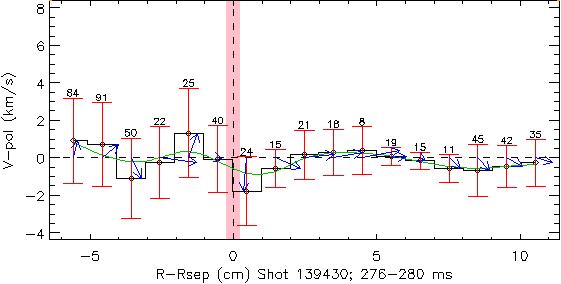
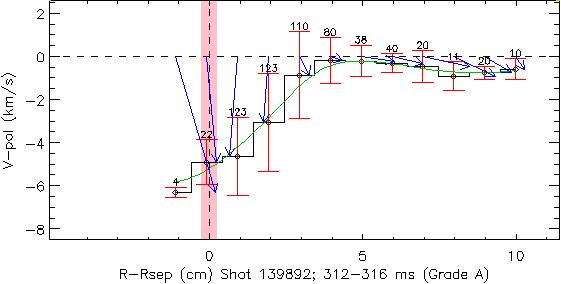
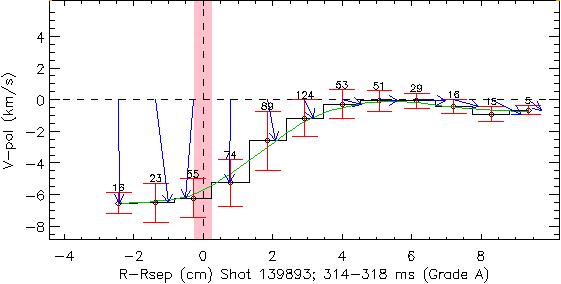
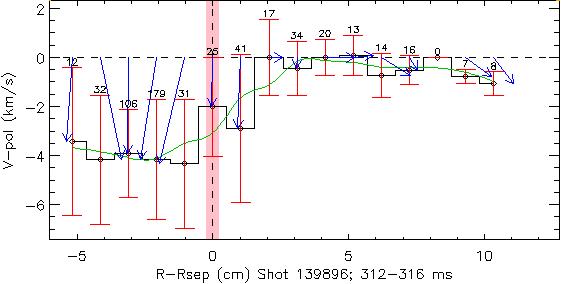
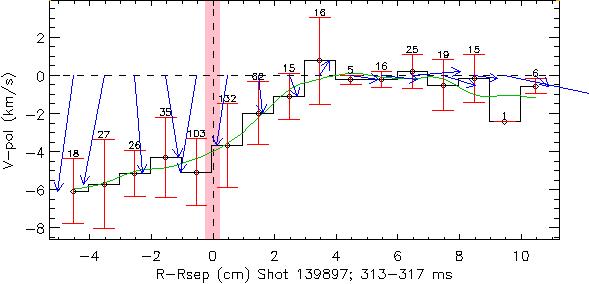
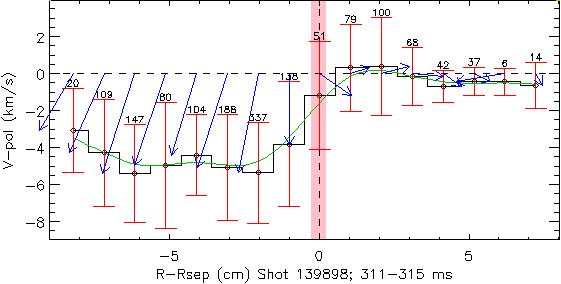
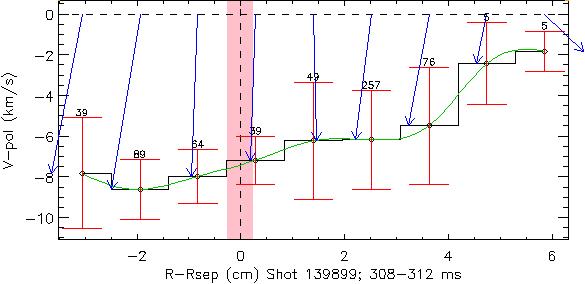
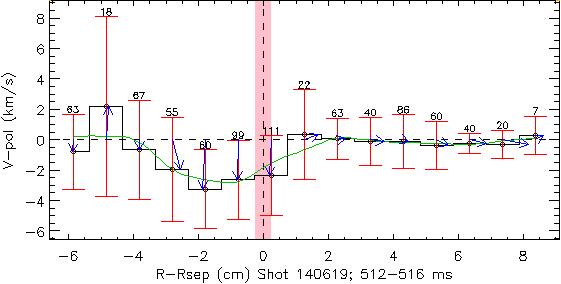
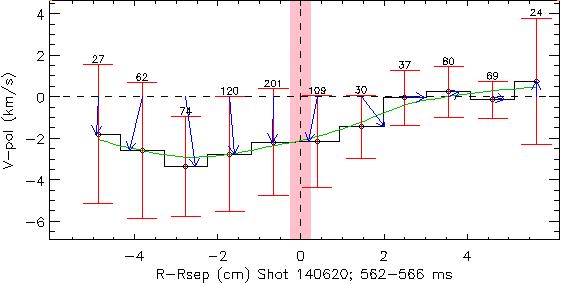
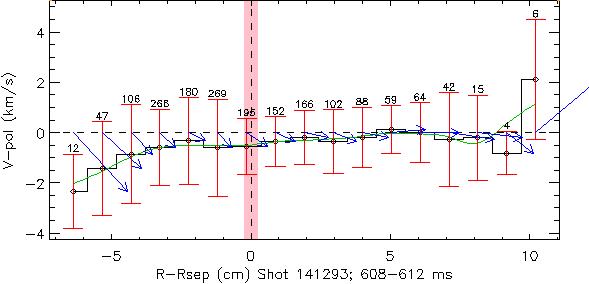
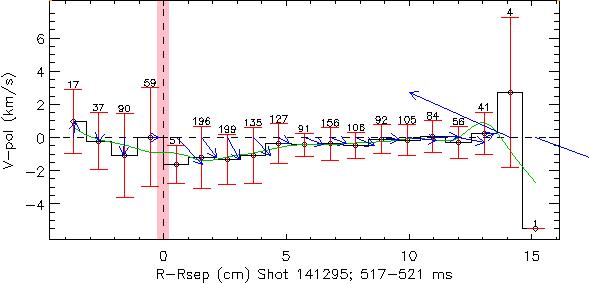
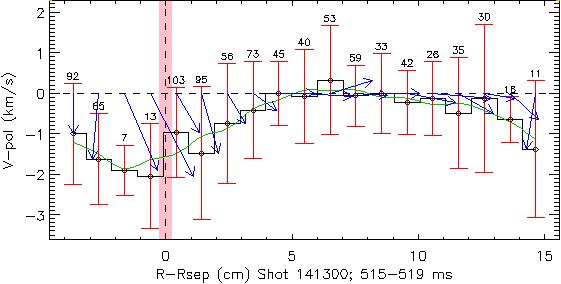
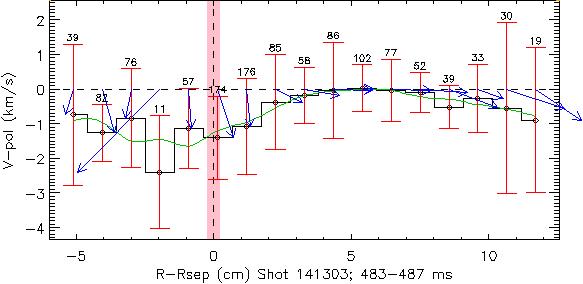
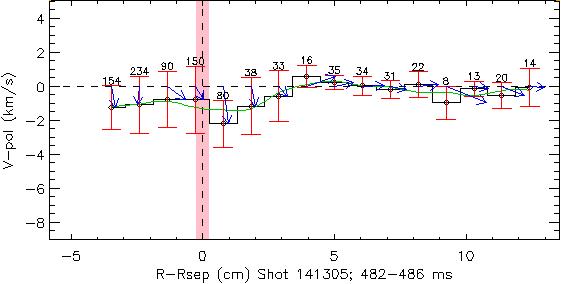
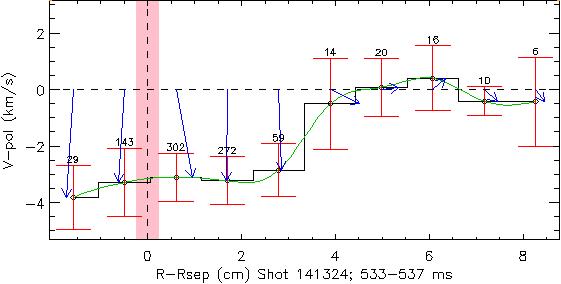
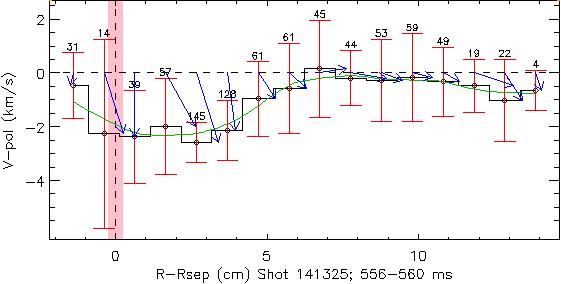
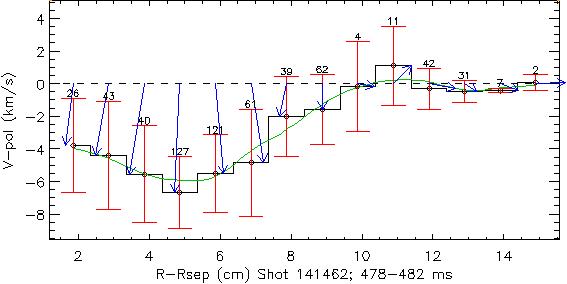
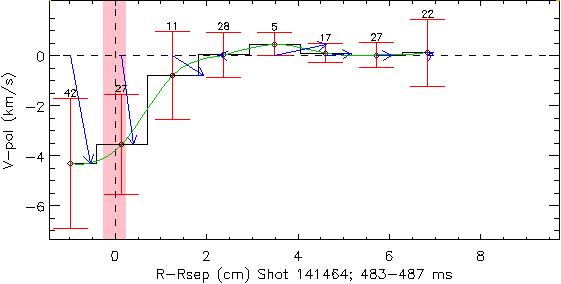
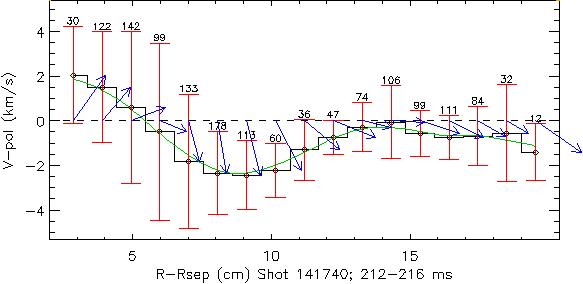
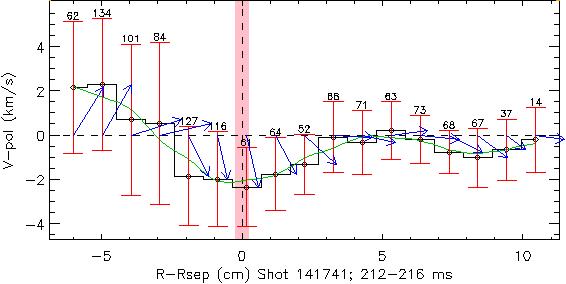
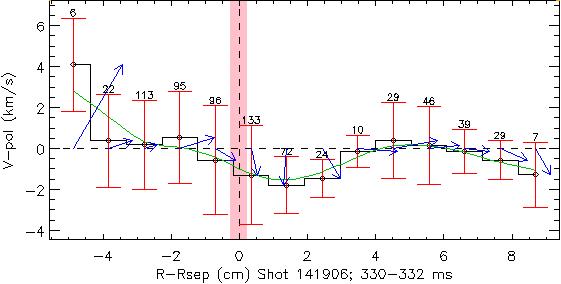
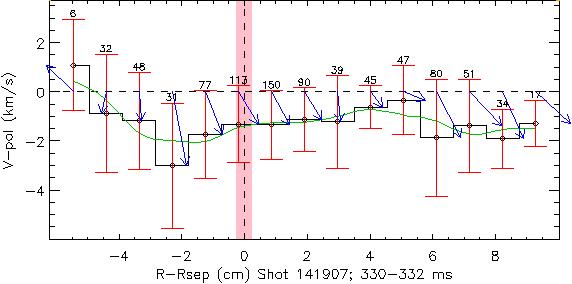
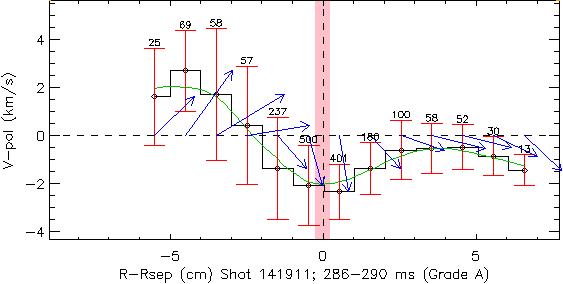
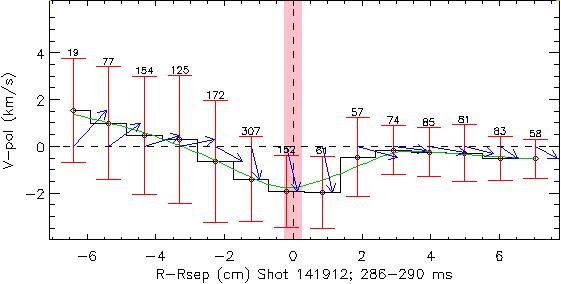
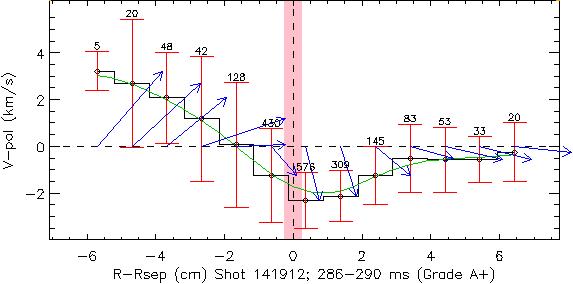
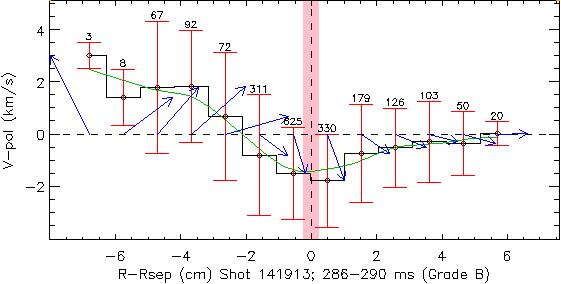
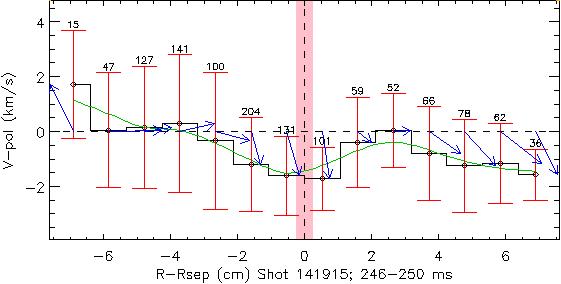
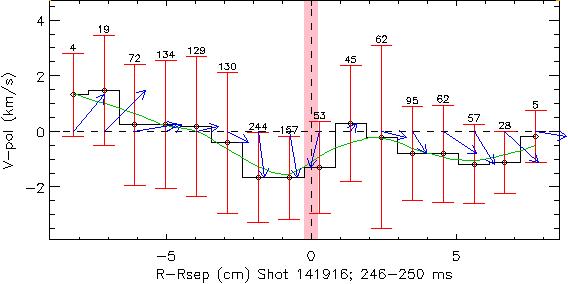
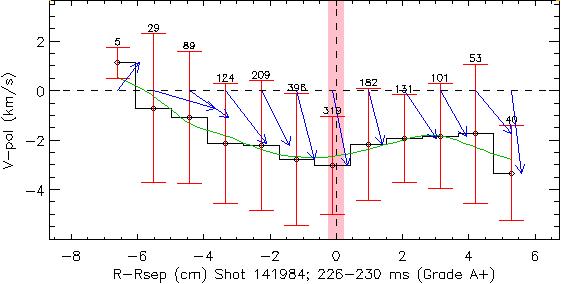
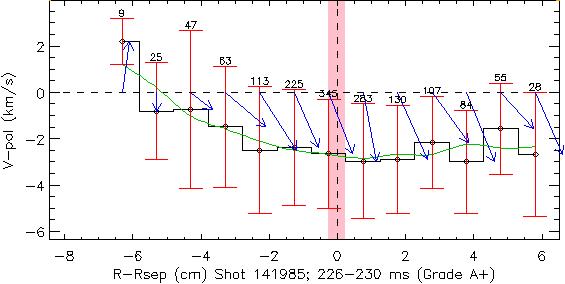
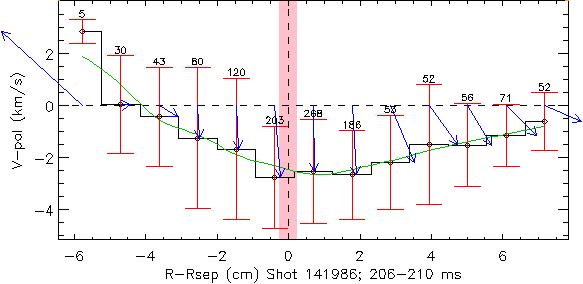
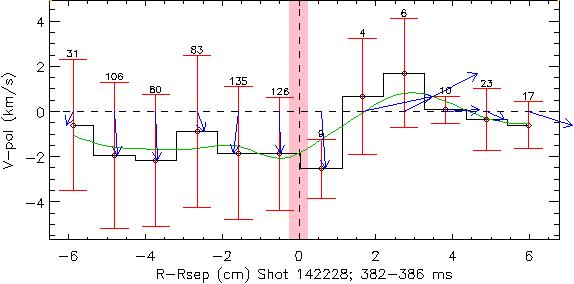
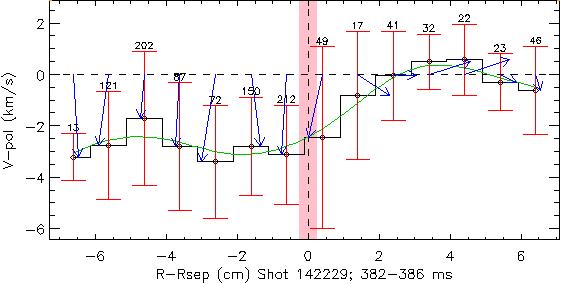
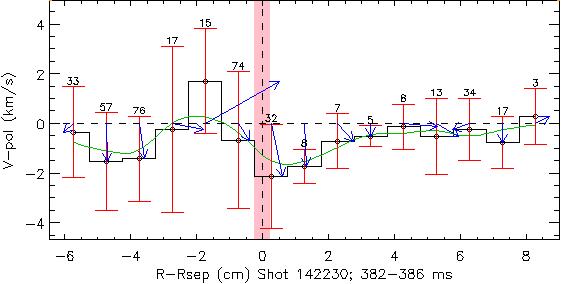
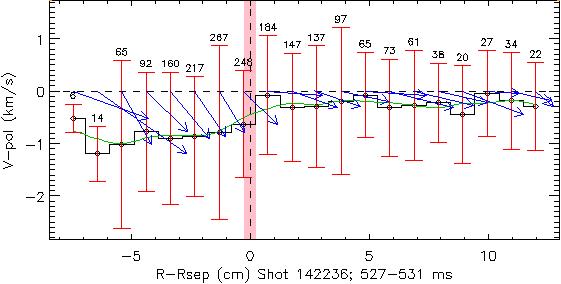
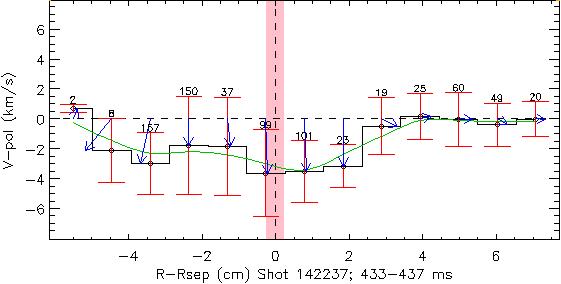
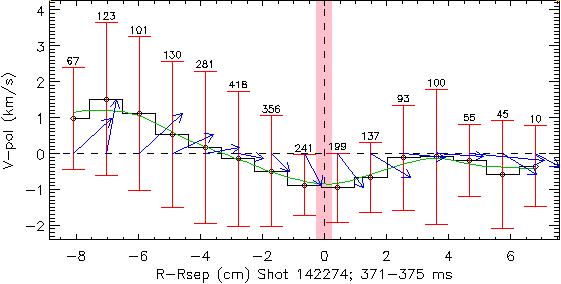
Plots on the left are blobs with Min Ht < 1.5.
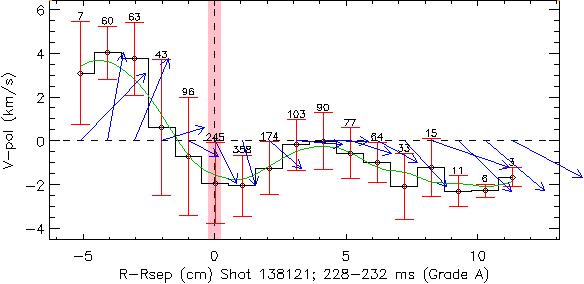
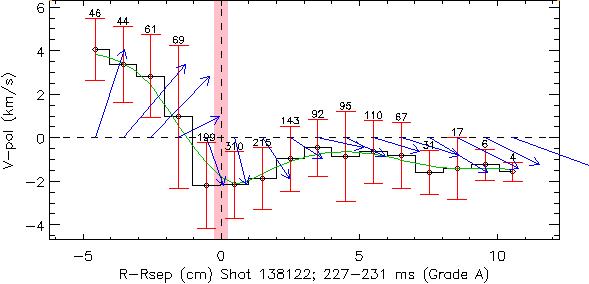
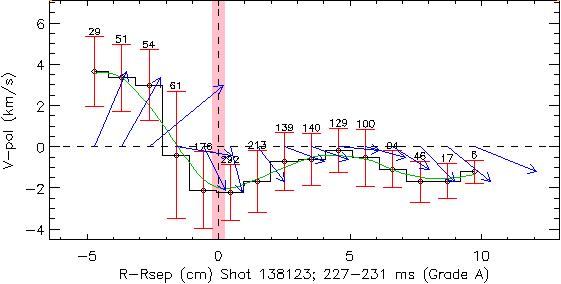
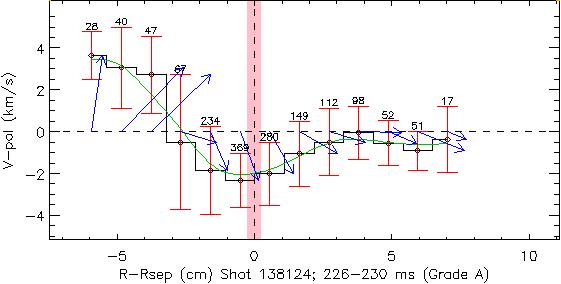
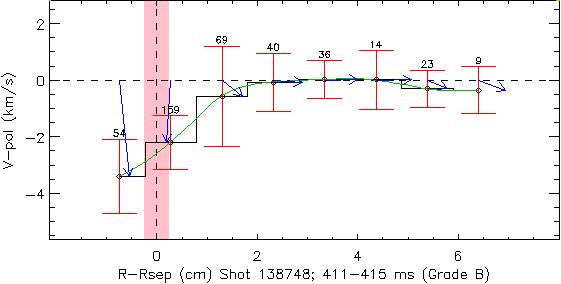
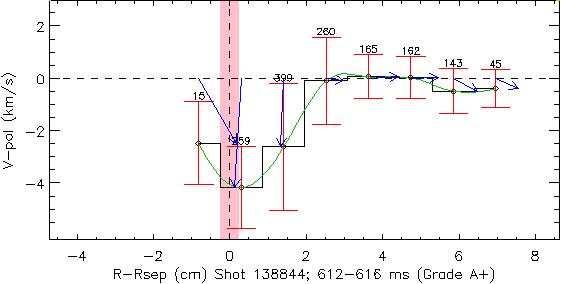
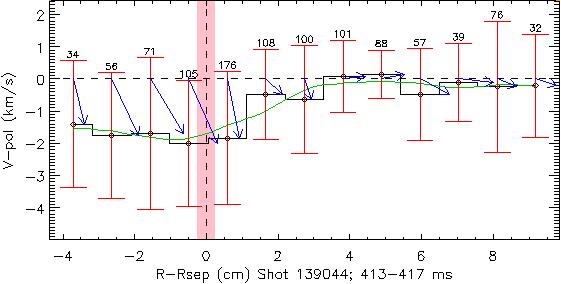
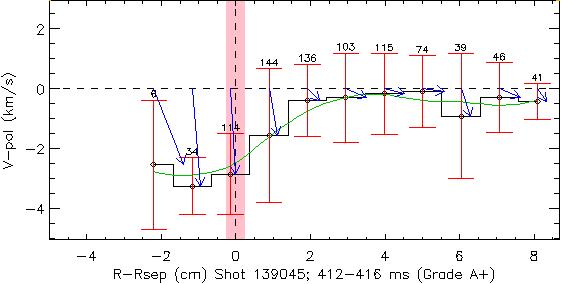
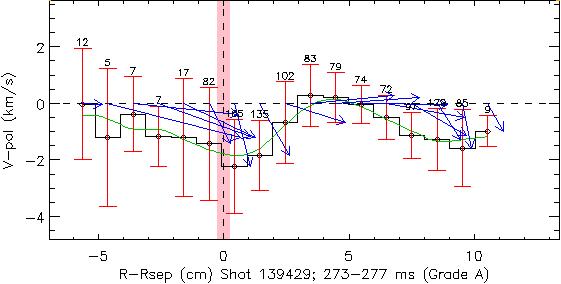
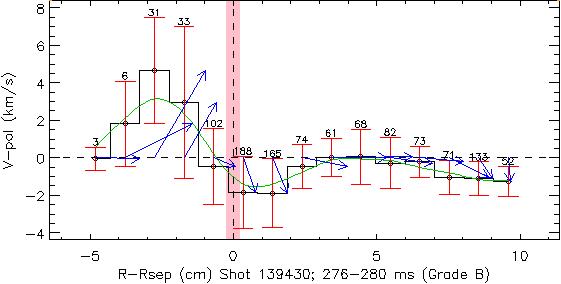
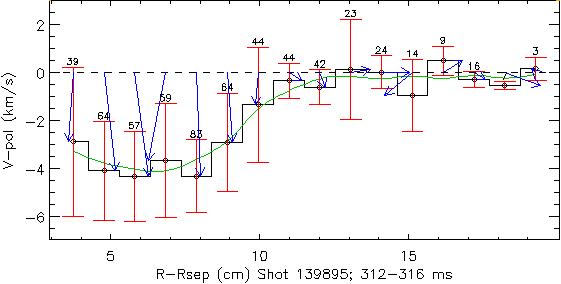
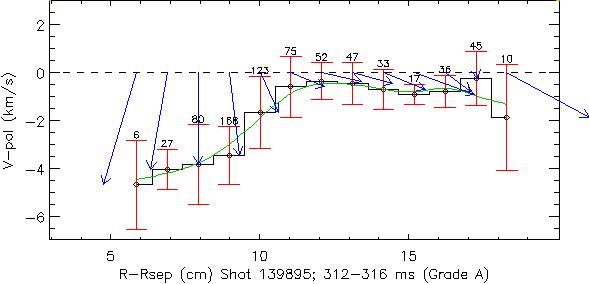
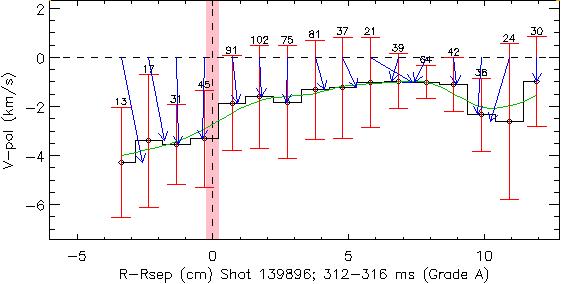
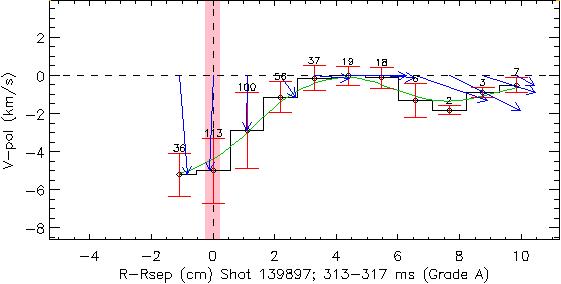
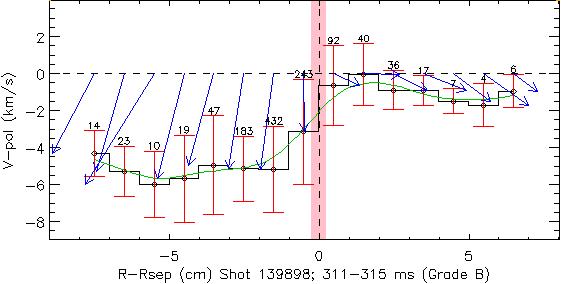
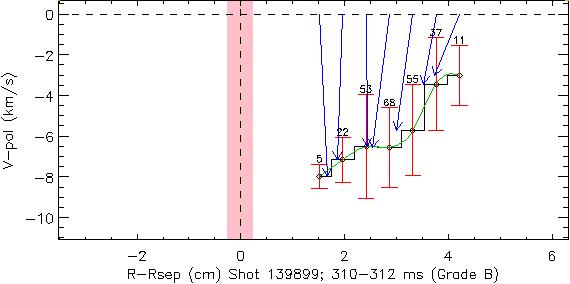
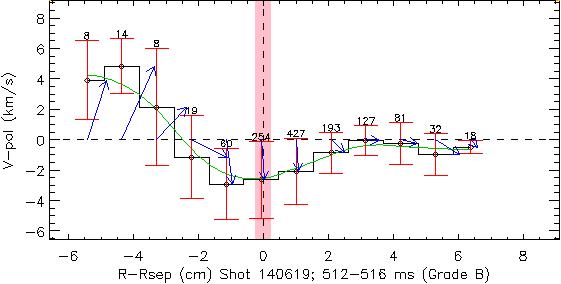
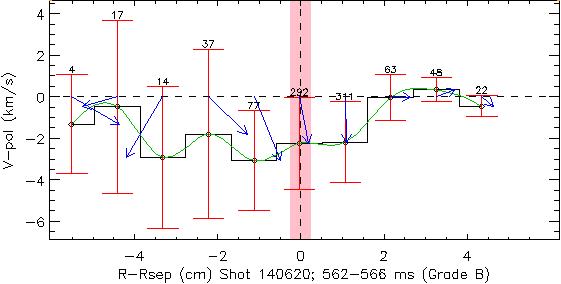
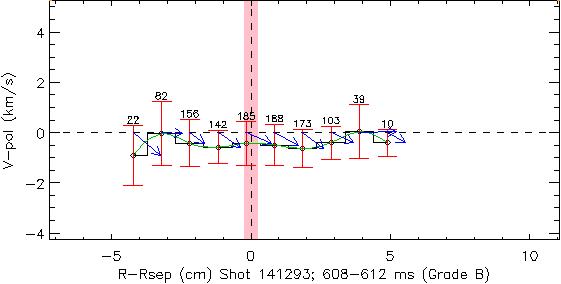
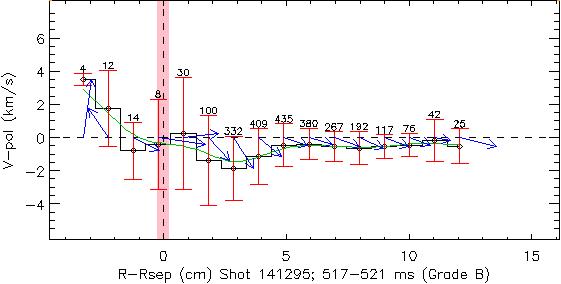
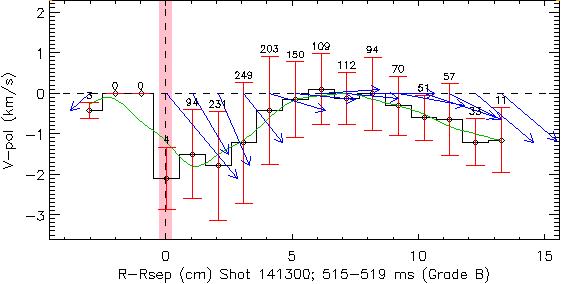
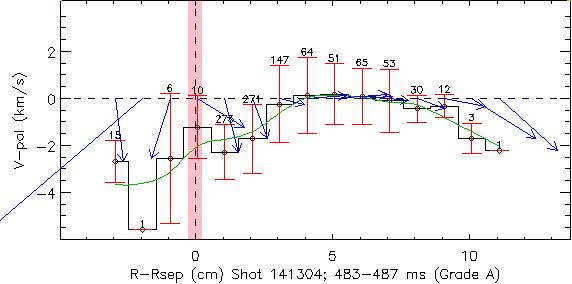
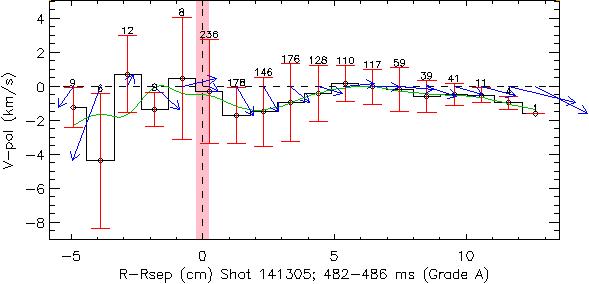
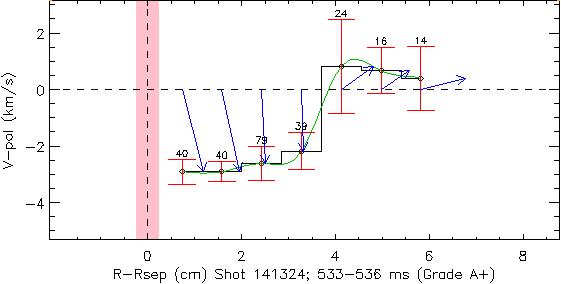
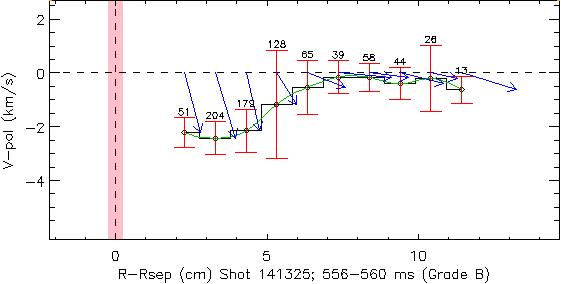
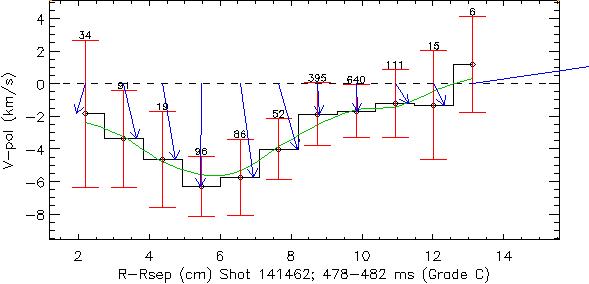
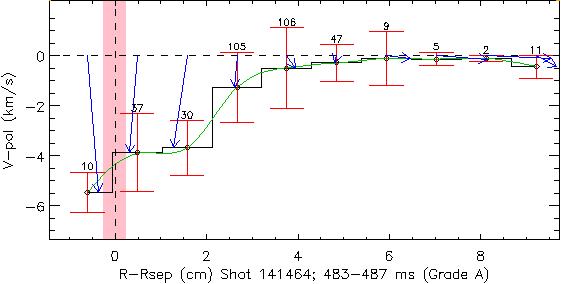
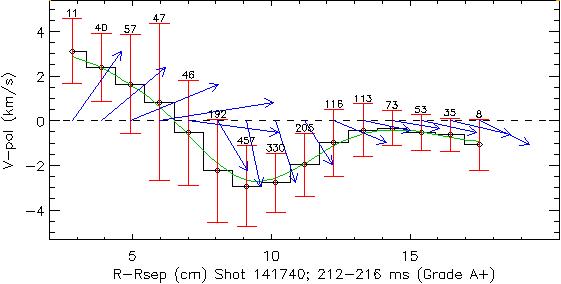
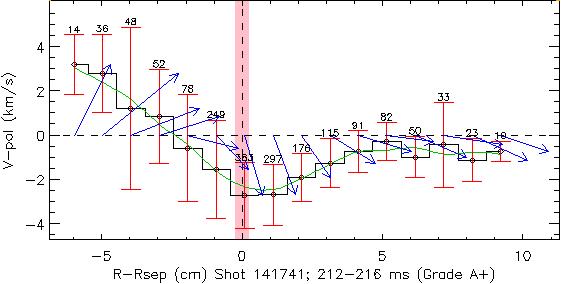
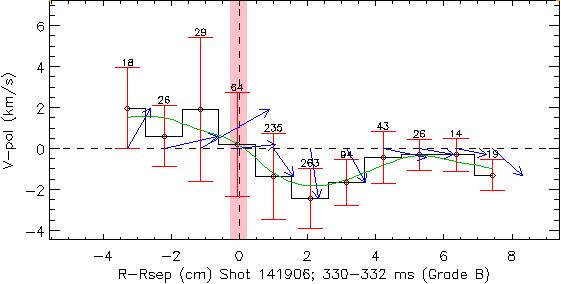
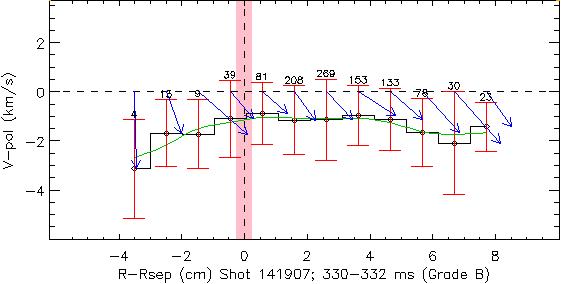
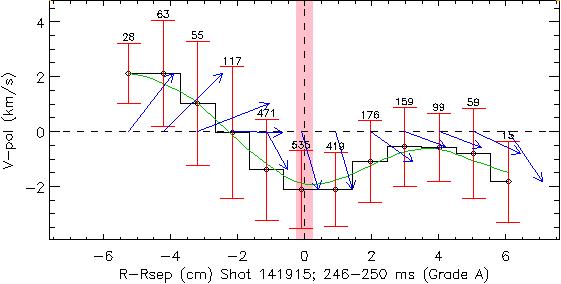
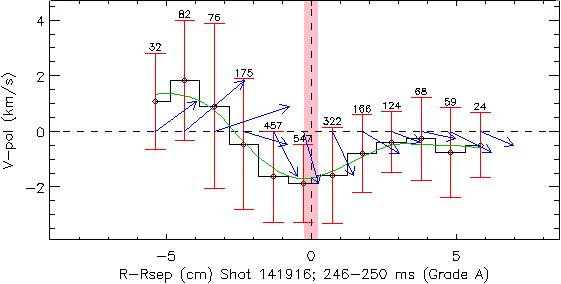
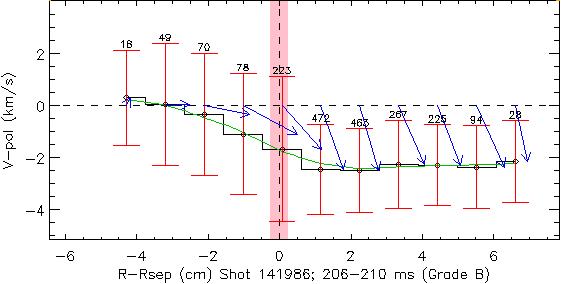
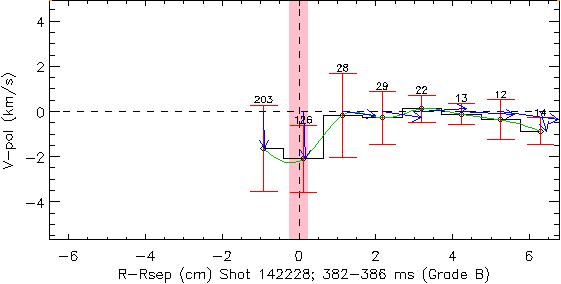
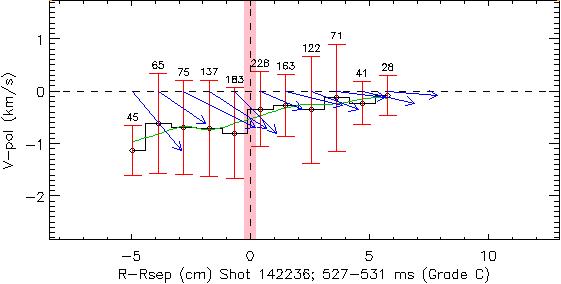
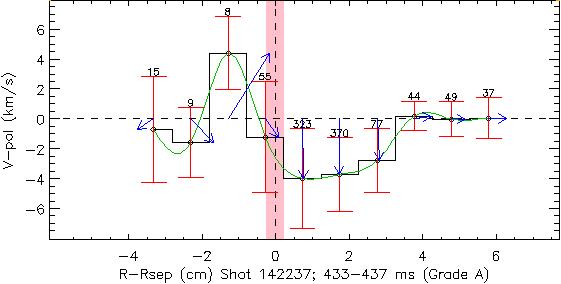
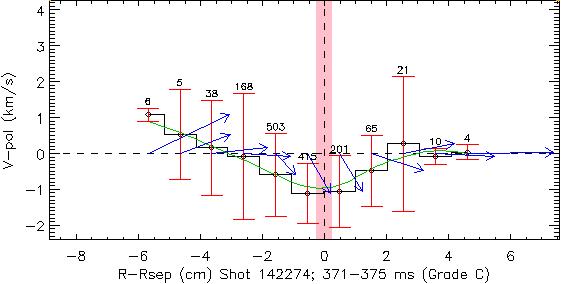
Plots on the right are blobs with Min Ht > 1.5
Return to the GPI page
Go to Web Tools
If you have questions or comments on this data, please send email to szweben or bdavis.