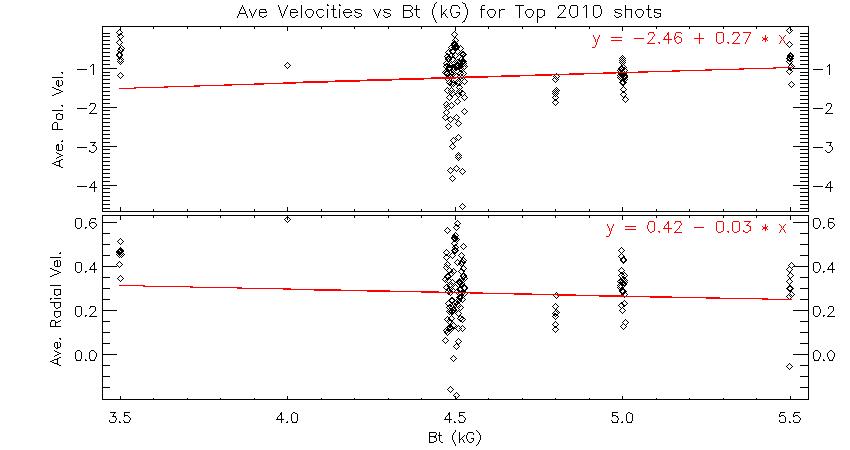
Note: Radial velocity decreases somewhat with increasing Bt. The top fit does not look right ???
The 150 shots with stable conditions around the peak of the GPI puff, taken at the fastest framing rates, during the 2010 NSTX campaign are included in these plots. These shots had good GPI data, a stable edge for several milliseconds around the time of the peak of GPI signal, and nothing else going on, like a transition in injected power, ELMS, L-H or H-L transitions, or visible influences from MHD activity.
Note: Radial velocity decreases somewhat with increasing Bt. The top
fit does not look right ???
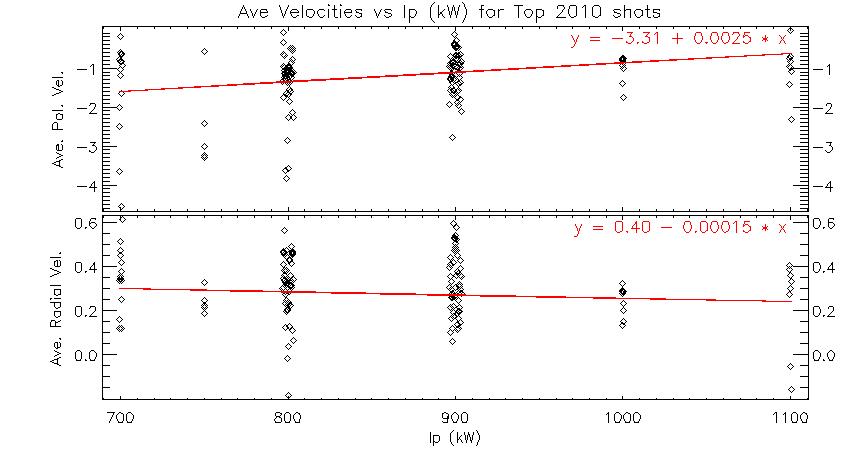
Note: Radial velocity goes down a bit with increasing Ip
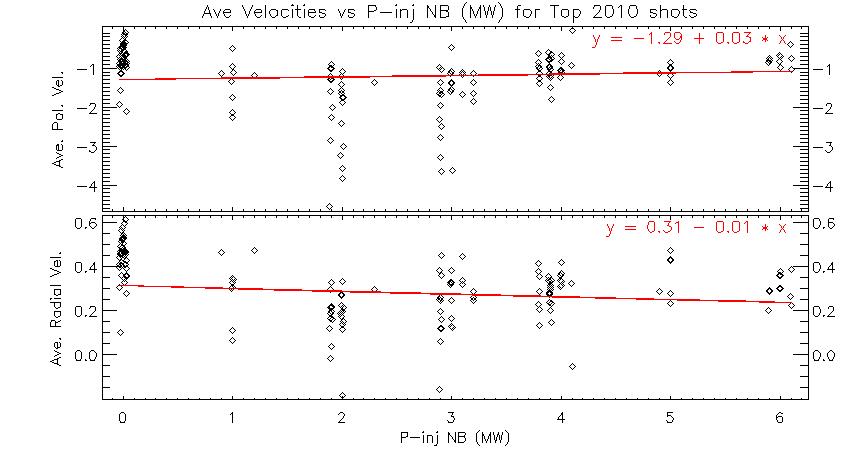
Note: Slight increase in poloidal velocities from increasing NB power,
and slight decrease in radial velocity. To the eye, it does not look
significant.
The Ohmic shots (no NB during GPI peak) have ~1 Km/sec
higher Poloidal Velocity and ~0.2-0.3 Km/sec
higher Radial Velocity.
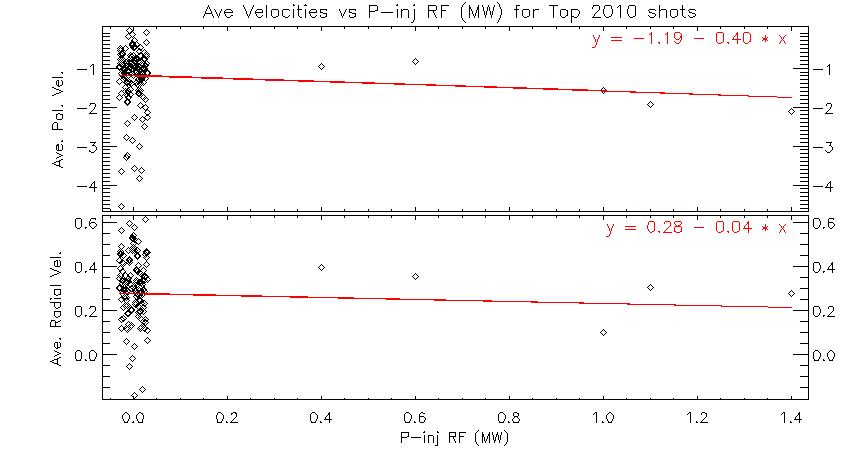
Note: There are not many shots with RF power injected (see
note at the bottom about spreading out ordinate values), but Average
poloidal velocity gets more negative at the larger powers.
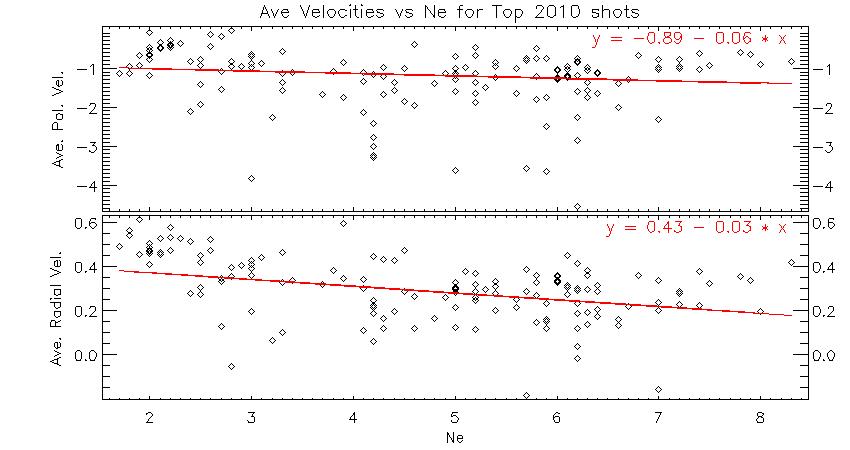
Note: Radial velocity goes down with increasing Ne. Slight decrease
Poloidal velocity with increasing Ne.
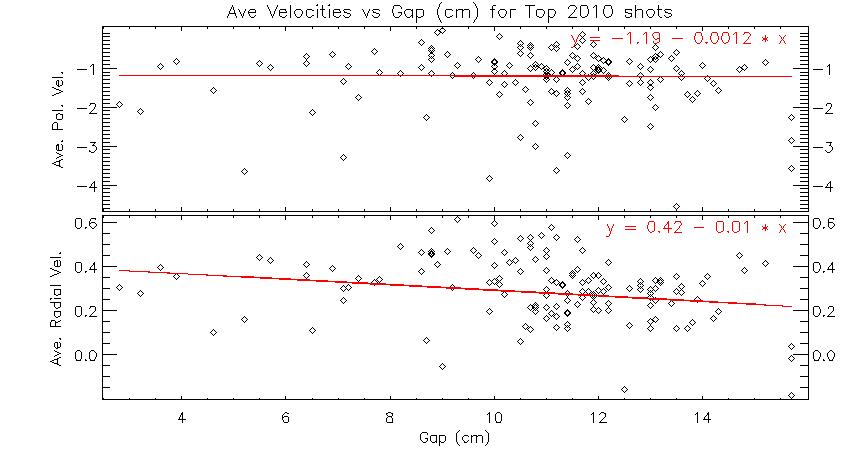
Note: Radial velocity goes down with increasing Gap.
No change in Poloidal velocity.
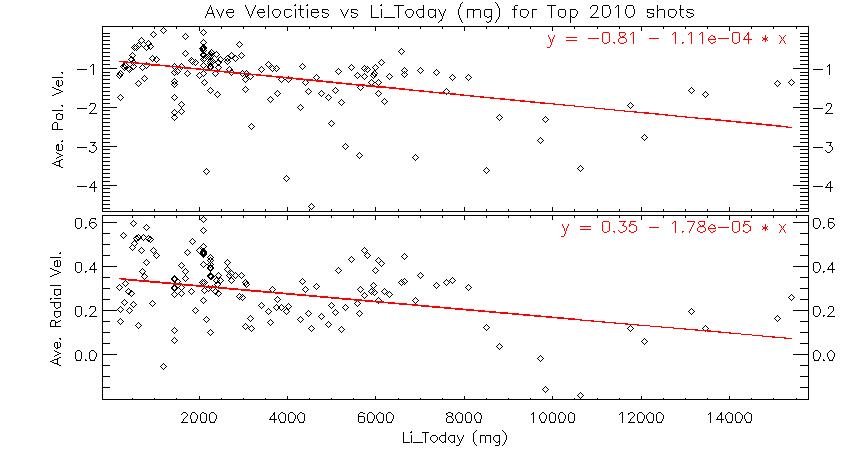
Note: For Li_Today (total for day up to that shot) downward
velocity increases with Li_Today and
Radial velocity decreases with increasing Li_Today
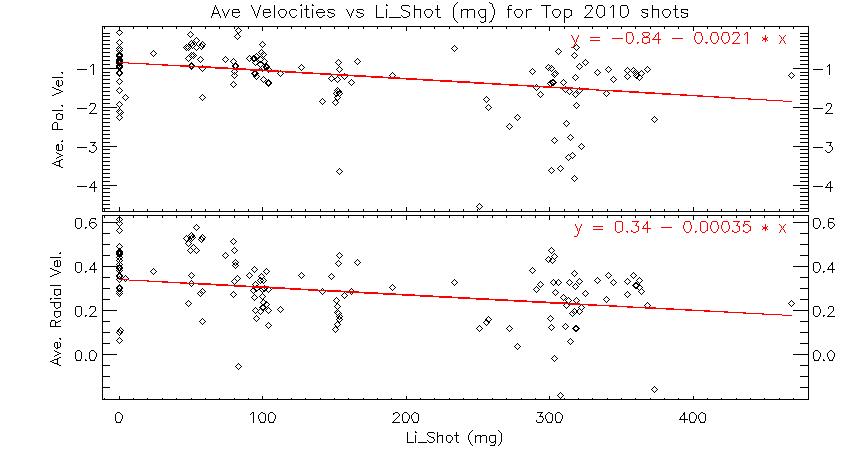
Note: Li_shot (amount deposited right before shot) very similar
trend to Li_today
Note that in order to see error bars from the same ordinate, like 0 RF power or 0 Li before a shot, the values are spread out in X a bit (though for very many points, it looks misleading).
If you have questions or comments on this data or these analysis tools, please send email to szweben.