| |
|
|
|
|
|
|
|
|
|
|
| |
|
|
|
|
|
|
||||
| |
|
|
|
|
||||||
| |
||||||||||
| |
|
|
|
|
|
|
|
|
|
|
| |
|
|
|
|
|
|
||||
| |
|
|
|
|
||||||
| |
||||||||||
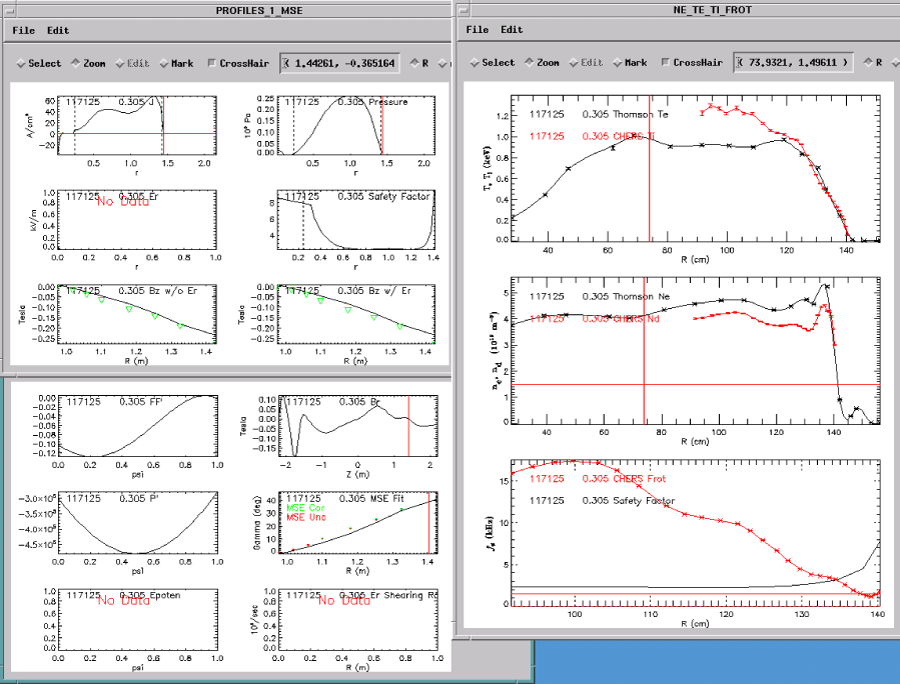
EFITviewer, developed at General Atomics, plots output from EFIT (Equilibrium FITting code) including diagnostic and other tokamak related overlays. Most outputs from EFIT runs may be plotted or listed in EFITviewer. See https://fusion.gat.com/theory/Efitsignals for a complete list of EFIT variables at GA (or this local copy). See PHOENIXdoc.html for EFIT at PPPL.
To use at PPPL:
---------------------------------------------------------------

sql2008
code_rundb
guest
pfcworld
---------------------------------------------------------------
The best way to create files needed for NSTX database access is to run the following on the Linux cluster (best to delete old files first, e.g., rm ~/*.sybase_login). If you are running the tcsh shell:
$NSTXUSR/util/setup/mkmdsplusdbfile.csh
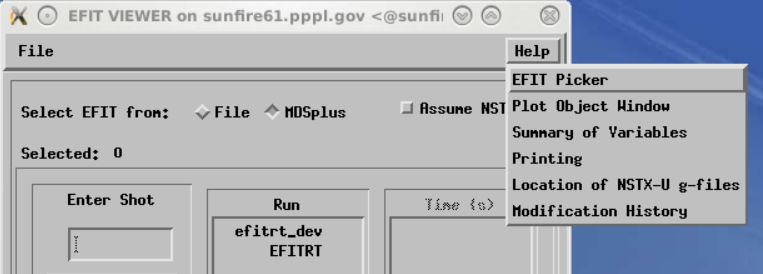
efitviewer


You can zoom the plot by dragging with the left mouse button. You can Control-click to record R-Z coordinates on this plot, as well as to the terminal window you started EFITviewer from.

Note that the Thomson and CHERS profiles may plotted as a funtion or R, rho, or psi.

Additions championed by Jose Boedo may be tested by invoking efitviewerbeta at the Linux command line.
Errors and questions may be directed to Bill Davis.
last modified 16-Nov-2016