| |
|
|
|
|
|
|
|
|
|
|
| |
|
|
|
|
|
|
||||
| |
|
|
|
|
||||||
|
|
|
|||||||||
| |
|
|
|
|
|
|
|
|
|
|
| |
|
|
|
|
|
|
||||
| |
|
|
|
|
||||||
|
|
|
|||||||||
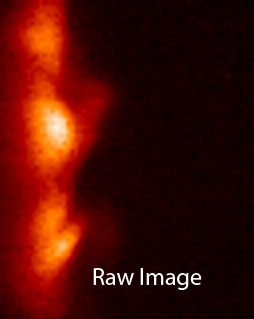
For Phantom camera files ("cine" files, with a .cin extension), a popular viewing option is the IDL routine FCplayer.pro. This page describes blob tracking starting with FCplayer.pro. Once various analysis parameters and desired ranges have been determined, a user can process many shots at a time as described in HowToAnalyzeBlobs.txt.
"Blobs," related to turbulence in plasmas, may be tracked in FCplayer.pro by using selections near the bottom of the Special Menu:
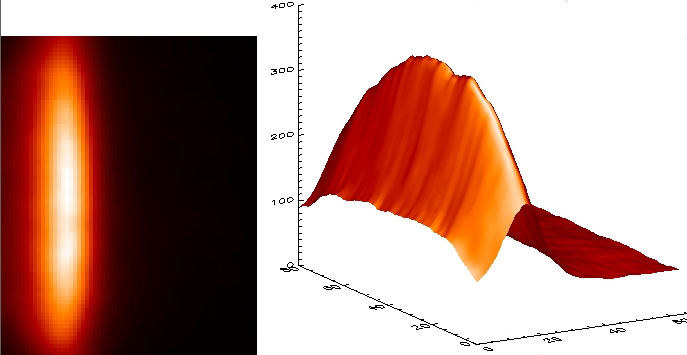
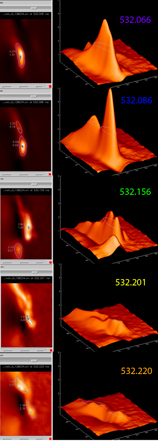
When blobs are tracked, a process called "Normalizing" happens in which each
camera frame is divided by an average over the whole
time interval (this result is shown in the second image, along with a shaded surface
representation of the data to the right).
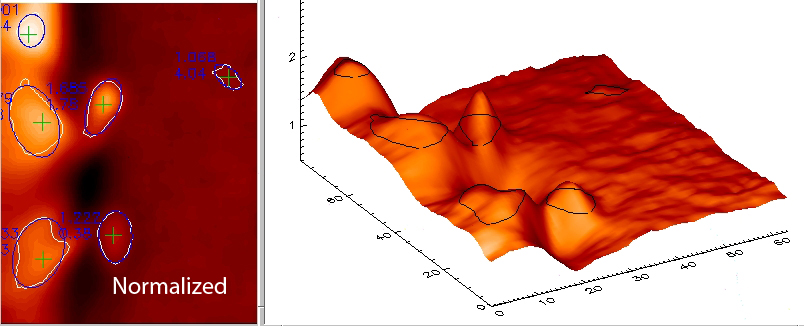
Since these images looking at the plasma edge (the separatrix) are darker outside the plasma (on the right side of the image), this normalizing enhances blob height in that region (the contour lines superimposed on the shaded surface plot look funny because they are not drawn with hidden line removal).
The "Averaged frame" used for normalizing from the two machines look rather different. A CMOD shot looks like this:
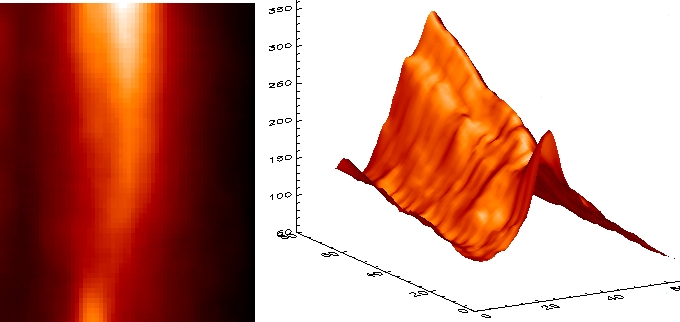
and from an NSTX shot:
The blob database, for the 2010 shots at least, was created from "normalized" images. The averaging time naturally affects the results, especially when there are different types of things happening over the time range. The loadblobs.pro code reads the "peaktime" from GPI_2010_Top_Shots.txt, and sets the averaging time as +/- 5 msec around the time of the peak of the GPI signal. This rather wide time window works for those "Top Shots" because they were selected because plasma characteristics were relatively stable during the 10 msec window.
The default in FCplayer.pro, on the other hand, doesn't know about this peak time and computes a different average frame every millisecond. When using FCplayer to check database blob characteristics, the AveT1 and AveT2 keywords should be set to the peaktime +/- 5 ms, and FrameAveDeltaMS=0 (which sets the average time to be the whole time range) for similar results.
Interactively adjusting values in the "Blob Criteria" widget in FCplayer, while looking at both the contoured image and the shaded surface plot, shows you what gets considered a blob, and how it looks in relation to it's surroundings.
Blobs are first identified on individual frames in FCplayer and then additional criteria, such as minimum lifetime, may be applied later.
Blobs on individual frames are identified in the following way:

|
|
|
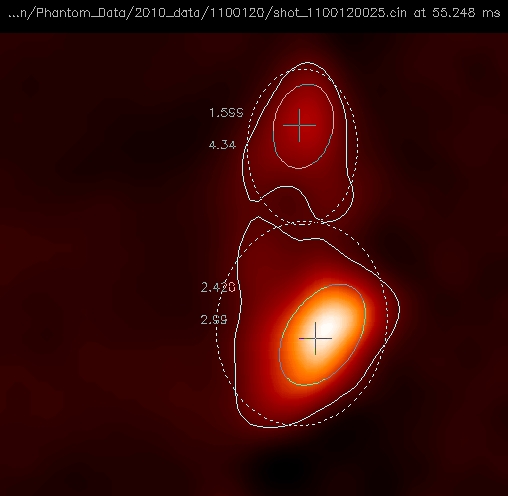
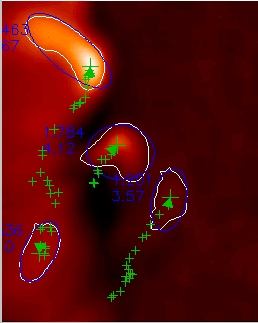
Since the base contour found with the above method frequently encompasses other surrounding features (like bumps), the resulting elliptical fit is not always shaped and oriented like the more pronounced part of the blob. A fit is also made at the blob's half-max (mid way between the base and the max) resulting in database columns xECenterHM, yECenterHM, radius1HM, radius2HM, tiltHM, chisqHM, and areaHM. These tend to be much better fits to an ellipse and agree with subjective determinations of blob orientation and shape, as shown in the figure on the left (the dashed line is the elliptical fit of the base contour). |
After this file of blobs on individual frames is written (it might take an hour to write out for 10 msec of camera data at 400,000 frames per second), a post-processing program is run, e.g.,
IDL> populateblobs, filename=filename, table=tableThis tracks blobs from frame-to-frame by looking at the blob from the previous frame whose maximum point was closest to the current point of maximum value (after a smoothing factor of 5 was used on the 64x64 images). To be considered a parent-child relationship, blobs must be less than a certain distance apart from frame to frame, currently set to 10 pixels for 400,000 frames per second with the pixels representing 0.334 cm on CMOD (0.25 cm on NSTX at 200,000 fps). The maximum area change can also be applied at this stage, but the nature of the ellipse fitting makes this criteria a bit suspect.
From this parent-child information, horizontal and vertical velocities are calculated, lifetimes, etc. All of this information is written to an SQL database (called blobs) on a PPPL SQL server, or to a tab-delimited file. Information like the original starting point of a blob, which blobs were it's parent and child, if any, are also written for easy plotting with generalized tools.
For example, DBaccess.pro can plot any of the parameters in the database verses any other, with various other constraints imposed:
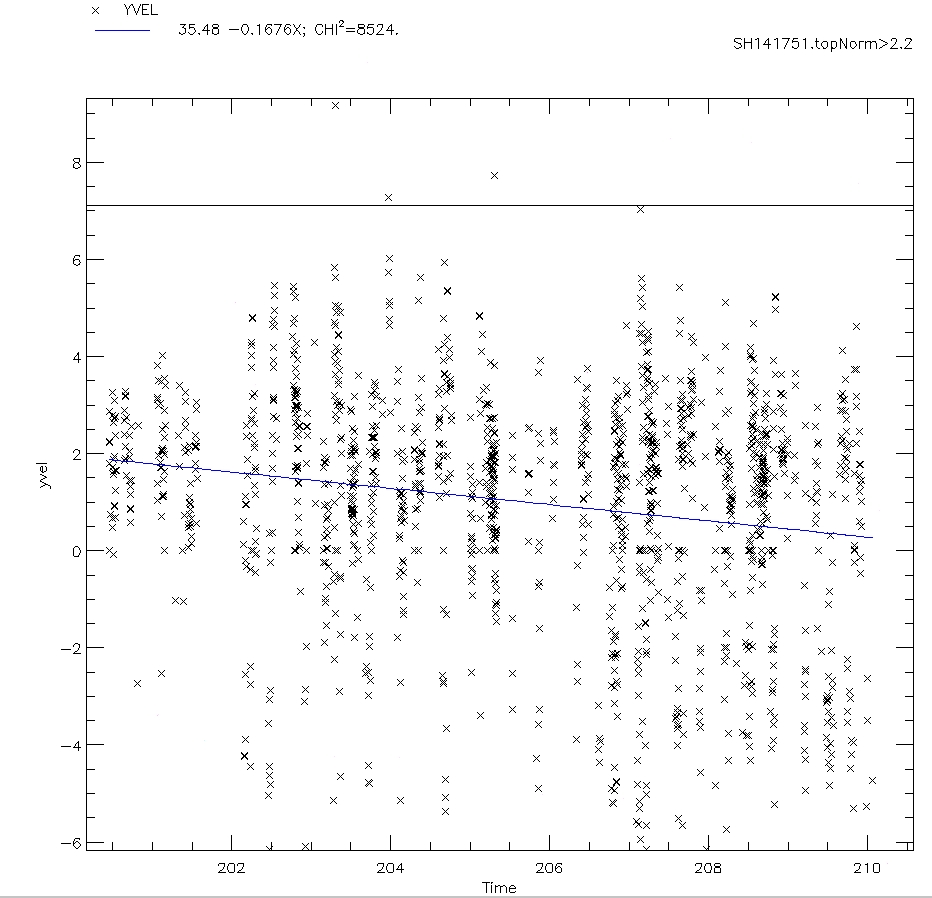
You can start this database display program at PPPL by:
IDL> DBaccess, 'blobs'
An explanation of columns in the tables in the blobs database can be found in blobDBdefs.txt
Other examples from other programs:
Once the database is available, FCplayer can display the track history of a blob, and/or an arrow indicating where it moved from the last frame:
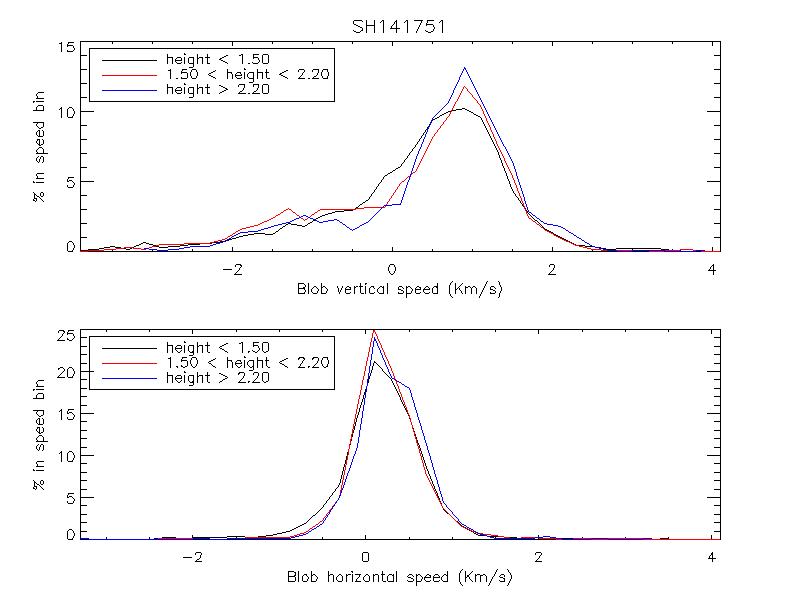
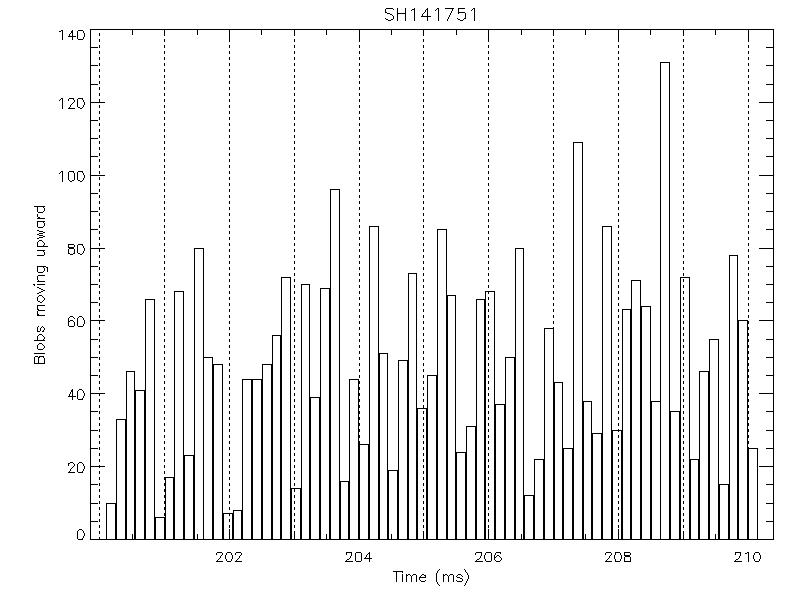
Stewart Zweben likes to compare blob horizontal and vertical speeds as a function of X and Y location.
IDL> blobspeedvscol, table=table, y1=8, y2=55, /show,/plot, outFile='VxVyVsCol_'+table+'.txt'The numbers above the histogram bars are the number of blobs in that bin.
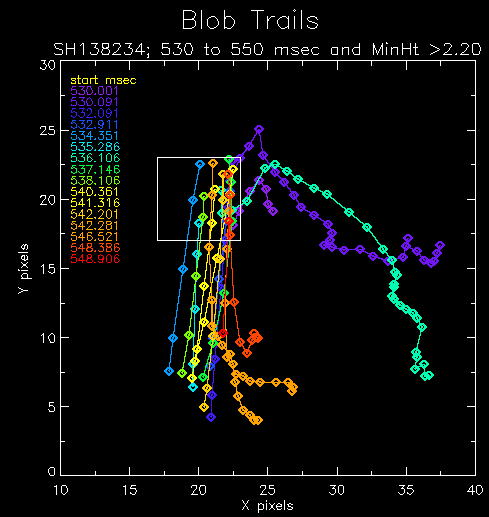
Another way to visualize blob tracks is to trace ones that went through, say, a 6x6 pixel box centered at pixels [20,20] (or use BlobTrails.html):
   IDL> blobtrails, 20, 20, boxRadius=3, shot=138234,  $
                    minHt=2.2, t1=530, t2=550, xSize=500, ySize=600, $
	            /ListTimes, charsize=1.8, psym=4, symSize=2,$
	            xplot1=10, xplot2=40, yplot1=0, yplot2=30

   IDL> mk_jpeg,'~/SH138234BlobTracks20.jpg'
In the picture below the X and Y arrays of coordinates were smoothed over every 3 points:
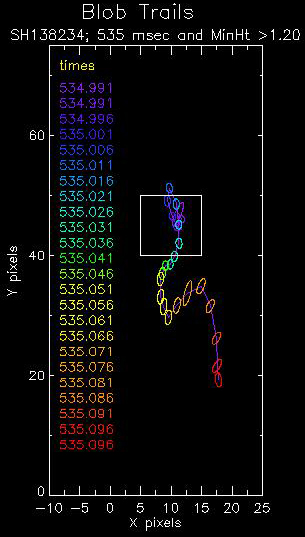
The next example keeps the ellipse symbol width the same, and draws the orientation and ellipticity accurately. The keyword /edge causes the plasma edge (separatrix from EFIT) and the limiter shadow to be drawn.
IDL> blobtrails, shot=138234, t1=534.5, t2=536, minHt=1.2,  $
        	x1box=10, x2box=15, y1box=35, y2box=45,  $
        	/ListTimes, /Ellipse, charsize=1.6,  $
		xplot1=-10, xplot2=25, symWidth=0.5
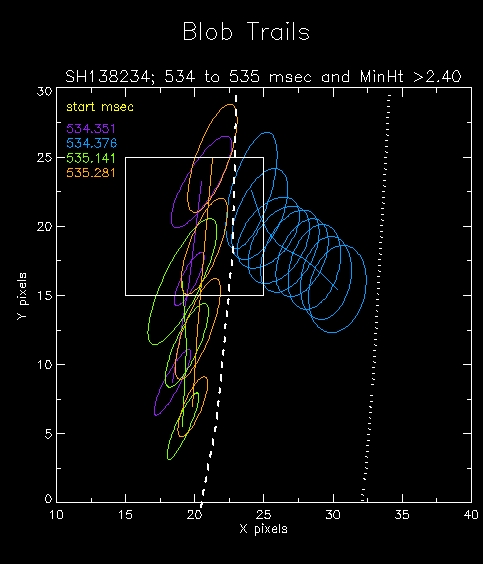
To show blob size changing, you set the keyword symWidth=0 (Ellipse width); scale=0.5 is used to better see the blobs as they move.
IDL> blobtrails, shot=138234, xpt=20, ypt=20, boxRadius=5, minHt=2.4,  $
            t1=534, t2=535.3, /ListTimes, /edge,  $
            charsize=1.5, symbol='Ellipse', symWidth=0, scale=0.5,  $
            xplot1=10, xplot2=40, yplot1=0, yplot2=30
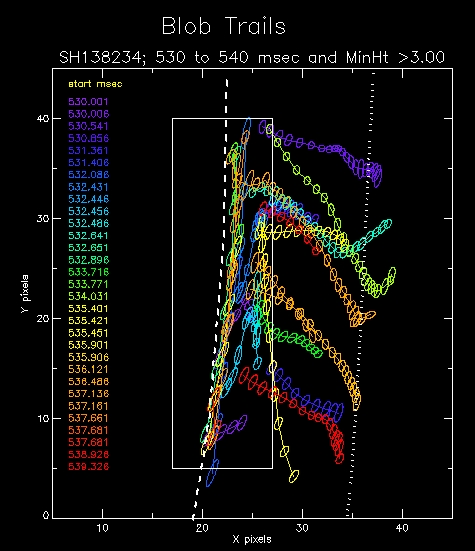
To see the track of one blob, along with the shape and orientation of the blob (actually the fitted ellipse) as a function of time (figure on left), select the times and other parameters to just find one blob, e.g.:
IDL> blobtrails, shot=138234, t1=530, t2=540, minHt=3, /ellipse, /edge, /listtimes, $
     x1box=17, x2box=27, y1box=5, y2box=40, xplot1=5, xplot2=45, yplot2=45,  $
     symwidth=0.3, charsize=1.2
The orientation and ellipticity of the symbols in the figure on the left
correspond to that of the data.
The figure on the right is composed of frames from FCplayer.pro at the color coded times.
You can use BlobMovies.html to create animations of blob movement.
See BlobSpeedValidation.html for details on how blob speed calculations were checked and verified.
(Several other applications analyze or display Fast Camera data on NSTX. See WhatsNew.html and Accessing_Fast_2D_Camera_Data.html.)