NSTX logo Overview Programming Diagnostics Applications
FAQ Web Tools UNIX & VMS MDSplus
software
Blob Trail Plotting Tool

   (To use this page from outside the pppl.gov domain, you must be authenticated at the firewall)

  Select Data Set:
Qualify blob starting location, etc.:

Box Center: Horizontal: Vertical: (pixels)
    and Box Radius:   (pixels)
OR:   X1:   X2:   Y1:   Y2:
Min Ht::   (Normalized, say, 1-3)
Max Jump to be part of track:   (pixels; <=10)
Max Chi Squared for ellipse fit:   (pixels; <=10)
# of consecutive frames required:    
# of points to smooth over:    
Times:   to (msec; can be relative)
Size of Plot Window:   Horizontal: Vertical: (pixels)
IDL Color Table # for tracks: (-1 for best rainbow palette)
Show Separatrix     Show limiter shadow
List times of blobs on plot with character size:
Symbols for blobs: None Diamonds Ellipses with widths of : (pixels) if=0,
                                                                            use actual ellipse sizes scaled by
Plot ranges:   X: to   Y: to pixels (blanks OK)
        Axes units in cm on plot.
Top title:
Suppress other title
Label every other major tick mark on X-axis     Suppress drawing the starting box.
        Prefered EFIT #: LRDfit #: (only for NSTX shots; see Fits available )


Create file:   None   Postscript   PDF   named: +.ext
e-mail file to:

( Modification History)                                                                                  
Blob movies are available. You can also generate your own. See BlobTracking.html for more on blob tracking.
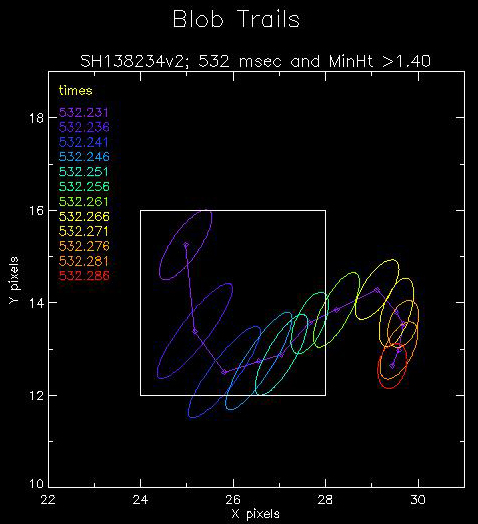
When only one blob meets all the criteria, the times and colors track a single blob, e.g.,

(If this page is not working, you may be able to diagnose problems with the server).


Edited 29-Oct-2013 by: Bill Davis