| |
|
|
|
|
|
|
|
|
|
|
|
|
|
|
|
|
|
|
||||
| |
|
|
|
|
||||||
| |
|
|||||||||
-
 What is the easiest way to plot NSTX-U data?
Where can I get a listing of the NSTX-U MDSplus nodes for
common parameters such as nebar, Bt, Ip, beam power, etc.?
How do I plot Ip for an NSTX-U shot in Python?
Is NSTX-U data available from the web?
Do I have to use IDL to analyze the data?
If I decide to learn IDL, where
do I start?
What TRANSP runs have been done, and how do I look at them?
Is there anything like MINGL and LOCUS?
What sort of relational database tools are there?
How do I know when the between shot EFIT analysis is finished?
What do the variables from EFIT mean?
My program needs the electron temperature and the plasma current as
well as my own data, and I want it to run automatically every shot.
How do I do that?
I want to put the results of my analysis in the tree, too.
How do I do that?
How do I interpolate a signal to a different timebase?
How can I get postscript or PDF files from the WebTools plots?
How can I make publication quality plots to place into Word and PowerPoint?
How do I run an IDL code, which normally reads from the command line,
from a script?
How do I create MPEG movies from IDL?
Why do I get an error accessing IDL on Solaris from Mac OS X?
Why do my IDL graphics get erased when covered up?
What tools are available for MHD spectral plotting?
How can I access Fast 2-D Camera data for NSTX or NSTX-U?
How can I read or write geqdsk or aeqdsk structures (gfiles &
afiles) from NSTX-U EFIT data?
How can I get the position of the separatrix (the last closed flux surface)
in the plasma from NSTX-U EFITs or LRDfits?
Can I call IMSL routines from IDL, or find ways to do B-splines, for
example?
What is the easiest way to plot NSTX-U data?
Where can I get a listing of the NSTX-U MDSplus nodes for
common parameters such as nebar, Bt, Ip, beam power, etc.?
How do I plot Ip for an NSTX-U shot in Python?
Is NSTX-U data available from the web?
Do I have to use IDL to analyze the data?
If I decide to learn IDL, where
do I start?
What TRANSP runs have been done, and how do I look at them?
Is there anything like MINGL and LOCUS?
What sort of relational database tools are there?
How do I know when the between shot EFIT analysis is finished?
What do the variables from EFIT mean?
My program needs the electron temperature and the plasma current as
well as my own data, and I want it to run automatically every shot.
How do I do that?
I want to put the results of my analysis in the tree, too.
How do I do that?
How do I interpolate a signal to a different timebase?
How can I get postscript or PDF files from the WebTools plots?
How can I make publication quality plots to place into Word and PowerPoint?
How do I run an IDL code, which normally reads from the command line,
from a script?
How do I create MPEG movies from IDL?
Why do I get an error accessing IDL on Solaris from Mac OS X?
Why do my IDL graphics get erased when covered up?
What tools are available for MHD spectral plotting?
How can I access Fast 2-D Camera data for NSTX or NSTX-U?
How can I read or write geqdsk or aeqdsk structures (gfiles &
afiles) from NSTX-U EFIT data?
How can I get the position of the separatrix (the last closed flux surface)
in the plasma from NSTX-U EFITs or LRDfits?
Can I call IMSL routines from IDL, or find ways to do B-splines, for
example?
What is the easiest way to plot NSTX-U data? |
You may access NSTX-U data in MDSplus through the Web Tools . (From outside PPPL, you will have to be authenticated at the firewall.) This web interface has some limitations, such as no dragging the mouse to select plot ranges. For such interactive features, on the Linux cluster, consider the SCOPE utility, jScope (jScope output example), EFITviewer, or other IDL-based programs, such as mdsw.pro.
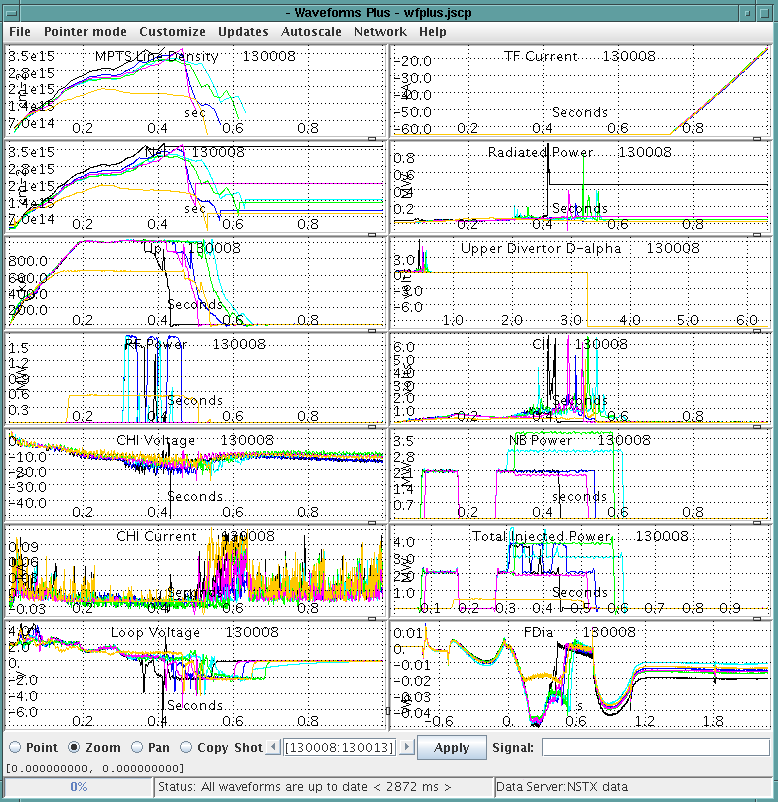
Where can I get a listing of the NSTX-U MDSplus nodes for common parameters such as nebar, Bt, Ip, beam power, etc.? |
Most of the common signals of general interest are in the scope displays the Physics Operators put up on the Display Wall. See for example /p/nstxops/util/scopes/wall_physics.scope. EFIT signal names of common interest can be found in /p/nstxops/util/scopes/efit02_params.scope.
- Ip - \ENGINEERING::IP1
- Neutral Beam Power - \NBI::NB_P_INJ
- OH Current - \ENGINEERING::IOH
- Neutrons - \top.neutrons.rawdata.nf_h908_01:input_01
- Inner gap - \EFIT01::GAPIN
- Elongation - \EFIT02::kappa
- Temperature, Channel 20 - DATA(\TEF)[*,20]
- Beta Poloidal - \EFIT02::BETAP
- Line Average Density - \ts_ld / 115
- Stored Energy - \EFIT01::WMHD
- B on axis - \efit02::BT0
How do I plot Ip for an NSTX-U shot in Python? |
See pythonplot.html
Is NSTX-U data available from the web? |
You may access NSTX-U data in MDSplus through the Web Tools . (From outside PPPL, you will have to be authenticated at the firewall).
Jscope is a powerful web-based utility distributed with MDSplus (now available on the Linux cluster at PPPL).
|
Do I have to use IDL to analyze the data? If I decide to learn IDL, where do I start? |
MDSplus may be analyzed from a variety of stand-alone tools, such as Scope, or even Excel (see NSTX-U MDSplus Data Plotting and Listing Tool on the web). There are MDSplus access routines for C, FORTRAN, Visual Basic, Labview, Perl, AVS Express, and probably many other languages. Many people find IDL the best programming language for custom applications. Tutorials and documentation are available.
What TRANSP runs have been done, and how do I look at them? |
Use the NSTX-U Transp Runs Listing Tool web tool.
Is there anything like MINGL and LOCUS? |
Most LOCUS features are available from VMS for the NSTX-U databases , which are MS-SQL databases. Locus was partially ported to Unix, as well.
However, much more friendly tools now exist, and are being supported. See " Relational Database tools", below.
Thanks to Steve Scott from MIT, locus is now available on the Linux cluster at PPPL. fill_db.pro lets you create your own databases from MDSplus data. Send email to dbadmin@pppl.gov.
What sort of relational database tools are there? |
- You can access the NSTX-U databases from
IDL -- type dbaccess at the IDL prompt.
See the
DbAccess manual.
You will need some special permissions to access databases. See New_NSTX_User_Setup.txt. You will need the appropriate *.sybase_login file in your home directory. The best way to create files needed for NSTX-U database access is to run the following on the Linux cluster (best to delete old files first, e.g.,
rm ~/*.sybase_login). If you are running the tcsh shell, typing the following will create the proper files:$NSTXUSR/util/setup/mkmdsplusdbfile.csh
- You can access the NSTX-U databases on the web from NSTX-U Tools.
- You can access the NSTX-U databases from Excel, which has some powerful statistical tools, if Data Analysis tools have been installed.
How do I know when the between shot EFIT analysis is finished? |
EFIT declares the MDSplus event 'phoenixDone_p1' when 'EFIT01' is loaded and 'phoenixDone_p2' when 'EFIT02' is loaded.
What do the variables from EFIT mean? |
A brief description is on-line. Tags in the MDSplus tree are also on-line. For more information, contact Steve Sabbagh.
My program needs the electron temperature and the plasma current as well as my own data, and I want it to run automatically every shot. How do I do that? |
Standard MDSplus data acquisition declares an event when each CAMAC module is acquired (this event name is typically the one used in Scope files for automatic update). If you know the digitizer of such a signal, you can find the event name in Traverser (or maybe some standard Scope file). When an analyzed signal is stored in an MDSplus tree, the program must explicitly declare an event. This can be anything, and you need to find someone who knows what it is.
Once the appropriate event is known, there are MDSplus routines to wait for it. These are accessible from other languages, such as IDL. For combinations of events, the most general way is to use the MDSplus Event Management System (MEMS).
I want to put the results of my analysis in the tree, too. How do I do that? |
If trees are designed with some care and attention to local style, benefits accrue. To create nodes in the NSTX-U Model Tree, you can use Traverser, TCL, or IDL. See nstxops for advice and examples.
How do I interpolate a signal to a different timebase? |
If signals are on different timebases, mathematical operations on the signals will NOT cause automatic interpolation. Brian Nelson's SigMath TDI routines are probably the easiest way to automatically convert signals to a common timebase.
At PPPL, there is an interpolation function (INTERP.FUN) for TDI that calls a FORTRAN routine built into a shared image on VMS. If you call MDSCONNECT before executing TDI on Unix, this function will work there, as well. Interpolation with this function assumes the signals have been created/built with time as the dimension.
The Web Plotting tools, like mdsplotlist.html, (as of September, 2007) automatically convert to the coarsest time base (using Brian Nelson's SigMath TDI routines).
How I can save and restore a plot with my favorite signals using the Web Tools plotting pages? I have been retyping the list of tags for every new plot. |
In pages like mdsplotlist.html you can have a list of signals (or signals and Y limits) in a spreadsheet or text file, copy the text, and click on "Paste a Column of signals from the clipboard" in one of these pages. On the PC, THIS WORKS WITH INTERNET EXPLORER but NOT WITH MOZILLA (they consider such pasting a security risk). It doesn't work with Safari on a Mac; if you have another browser you simply must use, send email to nstxops. See pastehelp.html for more information.
If you have cookies enabled in your browser, most pages should remember the signals you last used. If you have a few different sets you typically use, you can use mdsplotlist.html , mdsplotlist2.html , mdsplotlist3.html , ... mdsplotlist5.html , and each should recall it's own signals.
If you really just want to save the plot, you can email yourself a Postscript or PDF file containing the plot (see below).
How can I get postscript or PDF files from the Web Tools plots? |
After you have made something you like with a web plotting page, you simply check the box labeled "Postscript" or "PDF" below "Plot File", check "E-mail file to:", enter your e-mail in the field beside that, and then click on "Plot". The pathname where the postscript file can be found is also displayed in your web browser.
For printing plots similar to the MDSplus Scope Plotting Tool, you may wish to use printscope.pro from VMS or Unix/Linux.
How can I make publication quality plots to place into Word and PowerPoint? |
Bitmaps from a screen capture, Gif files or Jpeg files can be copied and pasted or placed into applications on a personal computer, but these generally look pixelated, and can look horrible when resized. Postscript graphics can look much more professional.
Make a Postscript file from IDL (using !p.font=0 will allow your fonts to be settable in Adobe Illustrator or Canvas, e.g.). You can also make Postscript files from many applications, and many canned IDL programs, by printing to a file. Many Web Plotting tools have an option to have Postscript or PDF files e-mailed to the user.
Open the Postscript file in Adobe Illustrator (if you need to rotate it, "Edit...Select All" and go to "Object...Transform...Rotate...", enter 90 and click "OK". Then select "File...Document Setup..." click on the landscape icon, and then click OK). Select "File...Save a Copy..." and select the file type to be "Illustrator EPS" and click "Save". In the resulting dialog box, under Preview, Format:, select TIFF and click on Opaque. When you insert this .eps file into Word or PowerPoint, it will look good, even when resized.
If you want to make high-quality figures from screen-dumps or bit-maps, see HiRes_JPEGs_from_Bitmaps.txt
How do I run an IDL code, which normally reads from the command line, from a script? |
You can use the shell 'here-document' operator <<. E.g,
    $idl << EOF
    create_f90_html_doc, filelist
    exit
    EOF
This also works in shell scripts.
(from Nigel Wade, University of Leicester, Leicester on IDL newsgroup)
See run_idl_from_script.html for another example.
If you want to have an argument (e.g., entering a shot number) for the batch invocation, do the following from Unix at PPPL:
	% cp $NSTXUSR/util/idl_cvs/idlbatch.pl  .
	% chmod  +x  idlbatch.pl
	% idlbatch.pl  myroutine 111340
Where "myroutine" is the routine (with one required argument) you want to invoke (in this example, passing in 111340 for the argument)
if "myroutine.pro" has multiple arguments, keywords, etc., enclose the argument string in quotes, e.g.,
% idlbatch.pl myroutine "111340, option='hi there'"
How do I create MPEG movies from IDL? |
IDL has commands to create MPEG files. $NSTXUSR/util/idl_cvs/mpeg_from_screen.pro is a simple example of creating a color Mpeg animation with text overlayed, handling both 8- and 24-bit color monitors.
However, the quality and/or speed may not be satisfactory when creating Mpegs using the standard IDL calls. Code may be found on the internet to create AVI files from IDL on a PC. AVI players usually allow speed control, and you may choose from a variety of compression/quality tradeoffs. Examples of better ways to make MPEGs using Unix commands include:
- /u/bdavis/Anim/Mpeg/mk_mpeg.pro plots lots of things to a Z buffer, then copies each frame to a PPM file. It creates an input file for mpeg_encode (which must be in your path) and spawns mpeg_encode.
-
$NSTXUSR/util/idl_cvs/write_mpeg.pro takes a 3-D array as input,
writes
gif files to a temporary directory, creates an input file to mpeg_encode,
which includes a "INPUT_CONVERT" command for giftoppm, and spawns
mpeg_encode.
Why do I get an error accessing IDL on Solaris from Mac OS X? |
There is a bug or incompatiblity somewhere that causes an error like:
   ld.so.1: /usr/pppl/rsi/idl_5.3/bin/bin.solaris2.sparc/idl: fatal:
   relocation error: file /usr/openwin/lib/libGL.so.1: symbol
   XPanoramiXQueryVersion: referenced symbol not found
   Killed
Use a Linux computer, such as nstxpool (if you are in the "nstx" unix group) or one of the portal computers.
Why do my IDL graphics get erased when covered up? |
You need a "backing store." Use the RETAIN keyword to the DEVICE or WINDOW commands. See idl_intro.html#BACKSTORE
What tools are available for MHD spectral plotting? |
combw3.pro plots freq. vs. time of NSTX-U MHD data. The latest version (on Linux) allows two graphics windows, each of which allows "scrolling back" to previous plots. Any modifications you make to the color palette of each window is retained for ladter plots to that window.
See $NSTXUSR/util/misc/mhd/combw3.pro, or just run combw3 in IDL (it should be in your path if you have done a "module load nstx/mdsplus" or a "module load idl").
Spectral fit plots for NSTX-U Toroidal Mode Numbers
How can I access Fast 2-D Camera data for NSTX or NSTX-U? |
See Accessing_Fast_2D_Camera_Data.html.
How can I read or write geqdsk or aeqdsk structures (g-files & a-files) from NSTX-U EFIT data? |
Steve Sabbagh's method is documented at http://w3.pppl.gov/~sabbagh/PHOENIX/PHOENIXdoc.html
Or see How_to_make_a_gfile.txt, which also contains a description of the variables in these structures.
How can I get the position of the separatrix (the last closed flux surface) in the plasma from NSTX-U EFITs or LRDfits? |
In both EFIT and LRDfit trees, tags \zbdry and \rbdry give the z & r coordinates of the plasma boundary at the times of the fits (each are 2-D arrays). \nbdry specifies the # of points to use from \zbdry and \rbdry at each time. See /p/nstxops/util/idl_cvs/plasmaedge.pro for an example of extracting the plasma boundary at a particular time (and the limiter positions).
Can I call IMSL routines from IDL, or find ways to do B-splines, for example? |
IDL Analyst has extensive support for IMSL routines. This package is an add-on to IDL, and PPPL only pays for 2 concurrent users. Documentation is in a pdf file called "IDL Advanced Math and Statistics" in the pdf subdirectory of the idl help (e.g. /usr/pppl/itt/idl/idl82/help/pdf). You can see if this feature is working by:
IDL> print, imsl_beta([1,2,3,4,5,6,7,8], [1,2,3,4,5,6,7,8]^1.1)

      1.00000     0.148404    0.0256832   0.00465998  0.000862022  0.000160824
  3.01080e-05  5.64111e-06
Since PPPL only has 2 concurrent licenses, if 2 people have an IDL session active that has accessed an IMSL routine, no one else will be able to use IDL Analyst. To see who has licenses checked out:
   [bdavis@sunfire06 bdavis]$ license-status idl_analyst

   Server: 1700@flexlmsrv.pppl.gov
   idl_analyst:  (Total of 1 license issued;  Total of 1 license in use)

   "idl_analyst" v8.200, vendor: idl_lmgrd
   floating license

   eric sunfire62.pppl.gov sunfire62.pppl.gov/sunfire62.ppp (v8.2) (voltron2.pppl.gov/1700 1137), start Fri 6/26 9:43